A micropore device
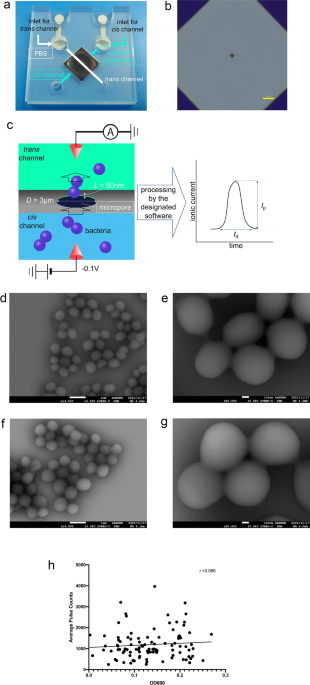
Micropores (3 µm in diameter) were fabricated on a 50 nm-thick silicon nitride film cast on a silicon substrate. The silicon substrate was sandwiched between a 25 mm × 25 mm 0.5-mm-thick plastic channel. This structure is termed “a micropore module” or “a module” (Fig. 1a, b). Bacterial suspensions (18 µL) in 1× phosphate buffered saline (PBS) and PBS (15 µL) were introduced into the cis and trans chambers, respectively. We measured ionic current–time waveforms through applying a voltage of −0.1 V between the Ag/AgCl electrodes placed in the flow channel. When the bacteria passed through the micropores, the ionic current decreased owing to obstruction due to the flowing ions (Fig. 1c). S. aureus and S. epidermidis are spherical in shape with a diameter ranging from 0.6 to 1.0 µm under a low vacuum of 98 hPa. We observed no specific differences in the bacterial structures through scanning electron microscopy (SEM) under the culture conditions (Fig. 1d–g). The waveforms were collected in the data server and analysed, as described in the “Methods” section. The number of available waveforms for the bacterial suspensions was independent of their optical densities measured at a wavelength of 600 nm (OD600) (Fig. 1 h). Therefore, sufficient bacteria were present in the suspensions regardless of their OD600 values.
(a) The structure of the micropore module. The micropore module is 25 mm2 in size and 0.5 mm thick. The bacterial suspension is introduced from the cis channel, and PBS is introduced from the trans channel. (b) An optical image of the pore of the module. The optical microscopic examination of the micropore module suggests that the 3 μm diameter micropore is in the centre of the silicon substrate. (c) A schema of the micropore. When the bacteria pass through the micropore, the ionic current decreases because of obstruction in flowing ions. The processing software obtains the change in ionic current as a waveform. (d) Scanning electron microscope (SEM) observation of S. epidermidis ×14,000. (e) SEM observation of S. epidermidis ×60,000. (f) SEM observation of S. aureus ×14,000. (g) SEM observation of S. aureus ×60,000. (h) A scatter diagram of the OD600 of the bacterial suspensions and their average pulse counts. No correlations were observed between the OD600 and pulse counts of the bacterial suspensions.
Bacterial movement and ionic current
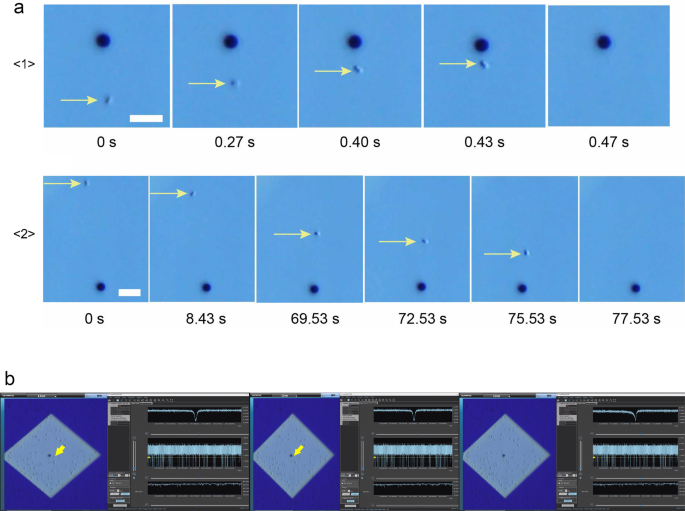
Ionic current measurements were performed on S. aureus and S. epidermidis cultures using micropore devices placed under an optical microscope. The base current was approximately 0.4 µA. Using the equations for access resistance (1/κD) and micropore resistance (4L/πκD2), the base current was estimated to be 0.5 nA when the ionic conductivity (κ) of 1× PBS was 1.61 Sm−1, the average diameter of the micropores was D = 3 µm, and the thickness of the micropores was L = 50 nm. The ionic current obtained was consistent with the theoretically estimated ionic current. With application of a voltage of −0.1 V, a single bacterium (black spot indicated by yellow arrow, Fig. 2a) was pulled into the micropore. Bacteria within an approximate radius of 15 µm from the micropore were pulled in at an accelerated rate as they approached the micropore (Fig. 2a \(\langle 1\rangle\)). When one bacterium passed through the micropore, we observed a single ionic current–time waveform, and the ionic current did not change until it entered the micropore. Bacteria within an approximate radius of 40 µm from the micropore were drawn to the micropore by Brownian motion (Fig. 2a\(\langle 2\rangle\)). The duration of Brownian motion was > 1 min while approaching the micropores. When a bacterium reached an approximate 15 µm radius from the micropore threshold, it was rapidly pulled into the micropore, which suggested it was being pulled under the influence of electric forces.

(a) Optical microscope images (scale bar = 10 µm) of S. epidermidis (small dot indicated by yellow arrow) being drawn towards and pulled into a micropore (3 µm black circles): <1> the bacterium near (within 15 µm radius) the micropore is pulled in at a fast rate; <2> the trajectory of a distant bacterium being drawn towards the micropore until it is pulled in. (b) Actual display screen during the measurement. The moment at which the bacteria (yellow arrow) is being sucked into the micropore. Its waveform is denoted on the right top column of the right-side window. The waveforms are indicated at three different time scales using the waveform viewer software.
Negatively charged bacteria were subjected to diffusion and electric forces between the electrodes. The radius (r) from the centre of the micropore at which the bacteria were trapped by the electric field is denoted by the equation:
$$r = d^{{2}} \mu \Delta V/{8}hD$$
where d, µ, and ΔV are the diameter of the micropore, the mobility of the bacteria, and applied voltage, respectively, and h and D are the thickness of the micropores and diffusion constant of the bacteria, respectively. The bacterial mobility and diffusion constants were approximately − 10−8 mV−1 s−1 and 10−9 m2 s−1, respectively. The experimentally observed r = 15 µm was relatively close to the theoretically predicted r = 22.5 µm. When the bacteria did not pass through the micropores, the ionic current remained constant at the base current, which was correlated with a non-event (Supplementary Material: the captured video of the actual screen during the measurement of the ionic currents of the bacteria. The optical microscopic image is shown on the left side, and the waveforms of ionic currents are shown on the right side). When a bacterium passed through the micropore, we obtained a spike-shaped ionic current–time waveform corresponding to one bacterium (Fig. 2b). The combination of optical microscopy and ionic current measurements demonstrated a correlation between the movement of a single bacterium and the ionic current–time waveform.
Creating the classifier
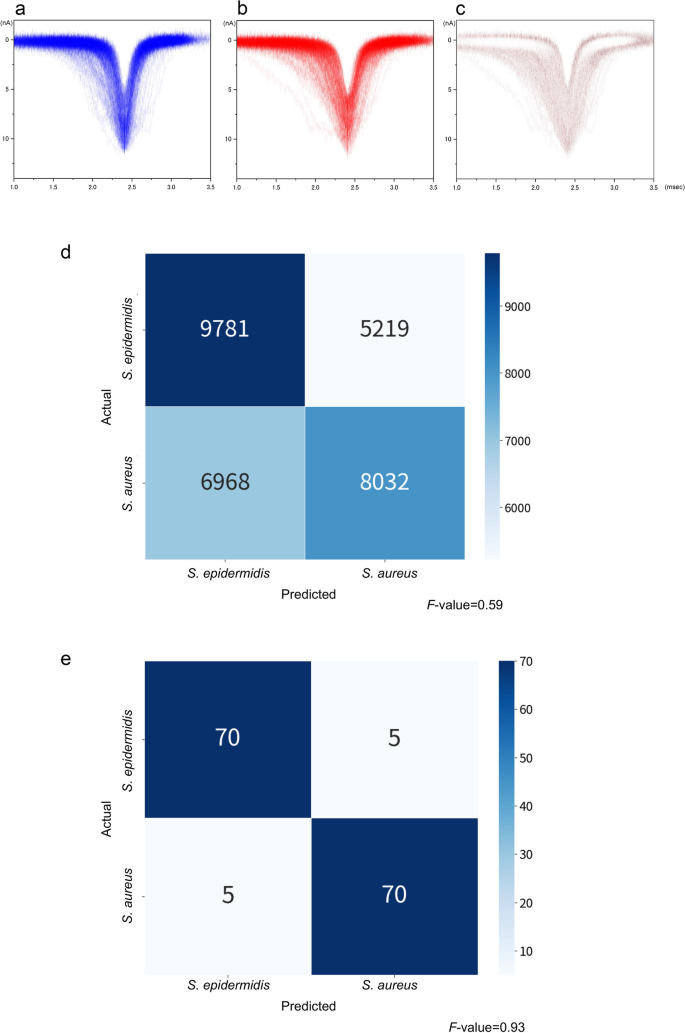
Spike-shaped waveforms are characterised by a maximum current value (Ip) and current duration (td) (Fig. 1c). The histograms of Ip and td nearly overlapped completely (Fig. 3a, b). Similar Ip levels reflected a small difference in the size between the two bacterial species. It was difficult to distinguish between them using these histograms. However, we observed differences in the shapes of the waveforms between the bacteria, suggesting distinguishable features (Fig. 3c). We used machine learning for identifying the waveform features such that the waveforms obtained could be used to identify the two species.

(a) Histograms of Ip and td of S. epidermidis. (b) Histograms of Ip and td of S. aureus. (c) Differences in the absolute value of the histograms of Ip and td between S. epidermidis and S. aureus. (d) Confusion matrix of all isolates. (e) Confusion matrix of the assembly machine learning results.
Fifty isolates of S. aureus and S. epidermidis were used for ionic current measurements. Each bacterial isolate was measured in triplicate using a micropore device, and each measurement lasted for 3 min. The 15,000 waveforms obtained from the measurements were provided as inputs for the machine-learning training set. The accuracy of differentiating between the two species in a single waveform was F-value = 0.59, which exceeded the F-value = 0.5 for random discrimination (Fig. 3d). In this single-waveform learning, it is determined which species each single waveform belongs to. The F-value is denoted by the harmonic mean of the sensitivity and precision, 2/(1/sensitivity + 1/precision), as follows:
$$Sensitivity= \frac{True \, Positive}{True \, Positive+False \, Negative}$$
$$Precision=\frac{True \, Positive}{True \, Positive+False \, Positive}$$
$$F-measure=\frac{2\times Sensitivity \, \times \, Precision}{Sensitivity \, + \, Precision}$$
For S. epidermidis, the confusion matrix yielded a sensitivity and precision of 9781/(9781 + 5219) = 0.65 and 9781/(9781 + 6968) = 0.58, respectively. This resulted in an F-value of 0.62. Similarly, the sensitivity and precision for S. aureus were 0.61 and 0.54, respectively, yielding an F-value of 0.57. The overall adopted F-value was the average of the F-values obtained for the two species. We determined the species-level accuracy of the bacterial identification on an isolate-by-isolate basis using machine learning. Of the 50 bacterial isolates, 25 were selected randomly as the training set for each species, respectively. We determined the training set yielding the highest F-value. Using the selected training set, we performed assembly learning to develop a classifier to determine whether a bacterial isolate belonged to S. aureus or S. epidermidis. In this assembly learning, single waveforms of one isolate/strain are treated as an aggregated data. Therefore, this assembly learning is an isolate/strain-focused learning. In contrast to the single-waveform learning, it is determined which species the aggregated data of each isolate/strain belongs to. In addition, the assembly machine learning uses the entire distribution of waveforms in each species, in addition to independent parameters (Ip, td, current vector, and time vector). The F-value was 0.93 (Fig. 3e).
Distinguishing bacterial pathogens
The classifiers created during the machine learning process were used to distinguish the remaining 25 bacterial isolates (Fig. 4a) and the additional ATCC standard strains. Each isolate was assessed by the classifier for three measurements, and two or three correct responses from the three trials were regarded as the final correct answers for the isolate or strain.

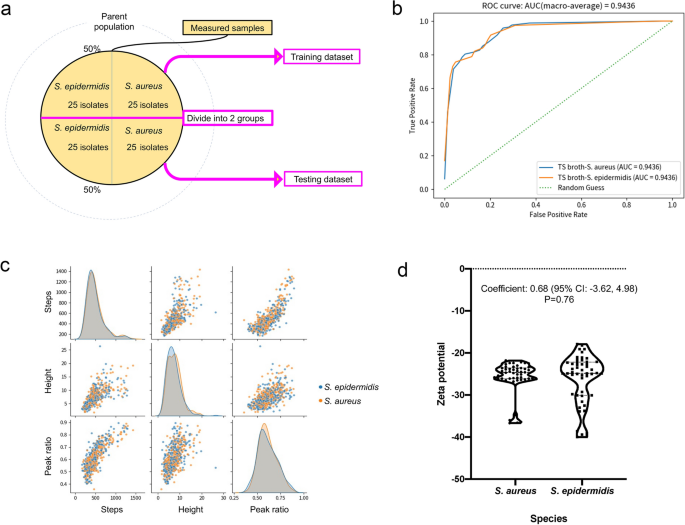
(a) Hold-out method. We employed a hold-out method for machine learning that splits data into the following two groups: a training dataset and a testing dataset. (b) Receiver operating characteristic curve of the classifier. (c) Characteristic distribution of the waveform. The pulse data are acquired 250,000 times per min. ‘Steps’ denote the number of data points acquired, ‘Height’ denotes the current value of the pulse, and ‘Peak ratio’ denotes the location of the peak of the pulse, when the left edge of the pulse is 0 and the right edge of the pulse is 1. (d) Zeta potential distribution of the bacteria. The dashed line denotes the median, and the dotted line denotes the quartiles. No statistically significant difference was noted between the two species.
The area under the receiver operating characteristic curve (AUROC) was 0.94 (> 0.9), demonstrating that the trained classifier could distinguish S. aureus from S. epidermidis at a high accuracy (Fig. 4b)20. The sensitivity and specificity for S. aureus detection were 96.4% and 80.8%, respectively, with an accuracy of 88.9% (Table 1). The positive agreement was 84.4%, and the negative agreement was 95.5% (Table 1).
Ionic current–time waveforms consist of information in relation to the size, shape, and surface charges of bacteria passing through the micropores. Micropore measurements demonstrated few statistically significant differences in the size and shape of S. aureus and S. epidermidis (Fig. 4c).
The Zeta potential affects the ionic current of the particles measured using the micropore device, and indicates the electrical charge of the surface layer of the particles21. Zeta potentials of the S. aureus and S. epidermidis isolates were measured using a Zetasizer™ (Malvern Instruments, Worcestershire, UK)22. The surface charges of the two species indicated that they were negatively charged, with Zeta potentials > −20 mV. While the Zeta potential range of S. epidermidis was greater than that of S. aureus and the distribution pattern was not completely the same, there were no significant difference between the Zeta potentials of S. aureus and S. epidermidis (Fig. 4d). Machine learning used surface charge differences between the two bacteria to distinguish between the species in reference to the entire distribution pattern of the features, of which difference is too subtle to statistically detect. The ion current–time waveform provides information on the volume, structure, and surface charge of bacteria passing through micropores. The machine learning, which inputs the shape of the ion current–time waveform as a feature, is considered to distinguish differences in surface charge.

Eugen Boglaru is an AI aficionado covering the fascinating and rapidly advancing field of Artificial Intelligence. From machine learning breakthroughs to ethical considerations, Eugen provides readers with a deep dive into the world of AI, demystifying complex concepts and exploring the transformative impact of intelligent technologies.


