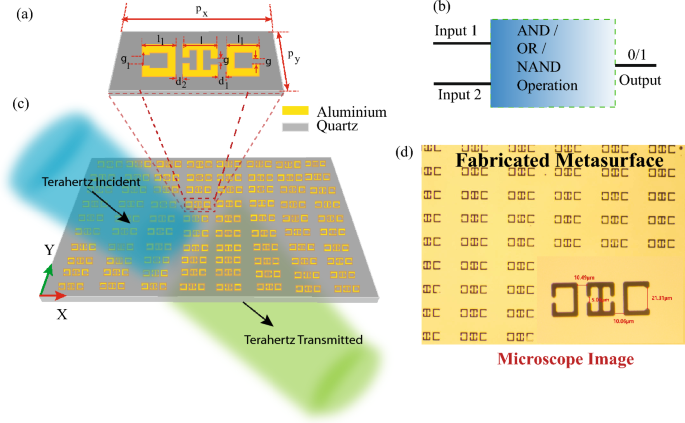
The study of Boolean operations is done via the change in the distance between the central resonator and the two other split resonators on the side of the central resonator. The initial configuration that was analyzed had a symmetrical structure with both the C resonators at a distance \(d_1=d_2=10\,\upmu\)m from the central SRR. The transmission spectrum for this symmetric configuration is discussed in the previous section, and shown in Fig. 2. We consider this configuration as the Boolean input “11” configuration. The displacement of the left-side side resonator from the central resonator by a unit of \(d_2=20\,\upmu\)m, while the right-hand side resonator is fixed at \(d_1=10\,\upmu\)m, is considered as a Boolean input “ 10”. This variation in the transmission for varying the distances of the C-shaped resonators from the central resonator is shown in Fig. 4. The experimentally measured transmission spectrums for the fabricated metasurfaces of varying \(d_1\),and \(d_2\) are depicted in Fig. 4a. The transmission spectrum for the \(“10”\) configuration is shown in Fig. 4a by the red curve. A blue shift in the first resonance dip is observed as it is shifted to 0.9 THz as compared to the “11” configuration. The configuration where the right SRR is at a distance \(d_1=20\,\upmu\)m from the central resonator, while \(d_2\) is fixed at 10 \(\upmu\)m is termed as the “01” input condition. For this configuration, the resonance dips are observed at 0.89 THz and at 1.05 THz as can be seen via the blue line in Fig. 4a. Further, the configuration where both the C resonators are separated from the central resonator by distance \(d_1=d_2=20\,\upmu\)m is termed as the “00” configuration. We term this as the “00” input as it is believed that increasing the distance between the central resonator and the C resonators will lead to a reduced near field coupling between the SRRs. Hence, the decrease in the near field coupling is assumed to correspond to the “ OFF” state or “00” state in our study. Similarly, we believe that the \(d_1=d_2=10\,\upmu\)m input state is the “ ON” state, or “ 11” state as both the C-SRRs will strongly couple to the middle resonator. For the 00 configuration we observe one resonance dip at approximately 0.89 THz and a broad resonance dip at 1.05 THz as shown by the pink curve of Fig. 4a. On varying the distances \(d_1\) and \(d_2\), a variation in transmission amplitude and resonance width is observed. The resonances become broader and there is an increase in the transmission depth as the distances are varied. It is evident that all the resonance dips and peaks of the transmission spectrum occur within a small window of 0.8–1.1 THz. For our study of logic gate operation in a MM, we intend to utilize this narrow THz window to explore the various logic gates in the metasurface.
(a) Proof of concept of Boolean operations for various input states of the metasurface at varying frequencies. A transmission amplitude of 80% and higher is taken as the cutoff for logic output state 1 (ON state) for experimental measurements, while a cutoff of 75% is taken for simulated results. The input states: 00, 01, 10, 11 are determined by the passive displacement of the C-resonators from the central resonator. (a) Boolean operation at 0.89 THz (AND), and 0.97 THz (OR) for experimentally measured results. (b) Boolean operations at 0.87 THz (NAND), 0.89 THz (AND), and 0.97 THz (OR) for numerically simulated results.
To realize the Boolean operations, we scrutinize the different regions that could exhibit logic gate outputs for the specified inputs for the window of 0.8–1.1 THz, as shown in Fig. 2. In this study, we fix a transmission amplitude of 80% to qualify for a Boolean output 1 state. A transmission amplitude less than 80% is assumed to be a Boolean output 0 state. The black curve in Fig. 4 indicates the input 11 state, the red curve indicates the input 10 state, the blue curve indicates 01 state, and the pink curve indicates 00 state, as discussed. It is observed that at 0.89 THz, the 11 state has a transmission higher than 80% while the 10, 01, and 00 states demonstrate a transmission amplitude of less than 80%. The truth table corresponding to this configuration at 0.89 THz is described in Table 1. The truth table output for all states besides the 11 states is Boolean 0, while the output for the 11 state is Boolean 1. From the truth table, Table 1, it can be understood that the metasurface at 0.89 THz corresponds to a Boolean AND operation. Further, the response of the metasurface at 0.97 THz is analyzed. The black, red, and blue curves corresponding to the 11, 10, and 01 input states respectively, and they all have transmission higher than 80%, while the pink curve corresponding to the 00 input state has a transmission less than 80% at 0.97 THz as can be seen in Fig. 4. The corresponding truth table is depicted in Table 2. The output of the truth table at 0.97 THz corresponds to the OR Boolean output configuration. Thus, the metasurface experimentally demonstrates AND, and OR Boolean operations at 0.89 THz and 0.97 THz respectively.
The experimental results are further verified using numerical simulations by studying the transmission spectrum of the metasurface for the different configurations of \(d_1\) and \(d_2\). The simulation results are depicted in Fig. 4b. The black curve in Fig. 4b illustrates the (1,1) configuration. The first resonance for the black curve lies at 0.87 THz and the second resonance dip is at approximately 1.05 THz. Further, the transmission spectrum corresponding to the other variations of \(d_1\) and \(d_2\) are also analyzed. The red curve in Fig. 4b corresponds to the simulated (1,0) configuration. The blue curve corresponds to the simulated (0,1) configuration, while the pink curve in Fig. 4b corresponds to the simulated (0,0) configuration. It may be observed that there is some small mismatch between the amplitude of the simulated transmission dips as compared to that of the experimentally measured curves depicted in Fig. 4a. These differences in the amplitude of the transmission dips may be attributed to the fabrication imperfections of the metasurfaces, environmental effects, diffraction losses, and due to the difference in the resolution of the CST-simulations and measured results using the THz-TDS setup. To take into account the shift in the transmission amplitude for the simulation results, a cutoff of 75% transmission is set for the Boolean output 1 in the simulated results. From Fig. 4b, it can be observed that at 0.89 THz, the black curve corresponding to Boolean input (1,1) is higher than the cutoff transmission, leading to a Boolean output of 1. The other curves corresponding to input configurations (1,0), (0,1), and (0,0) are below the cut-off transmission of 75%, hence leading to a Boolean output of 0. The truth table for the simulated curve at 0.89 THz matches with the truth table in Table 1 for AND Boolean operation, illustrated for the experimentally measured results at 0.89 THz. Thus numerically, AND operation is obtained at 0.89 THz. Next, the response at 0.97 THz is analyzed, and it is observed that the simulated curves have transmission higher than the 75% cutoff for all input configurations, corresponding to a Boolean output 1, except the (0,0) configuration which corresponds to a Boolean output 0. This is matched with the truth table for OR gate as depicted in Table 2. Thus, at 0.97 THz, simulation results match with the experimental results, and OR operation is obtained. Hence, the metasurface demonstrates AND and OR Boolean operations in the THz domain.
NAND operation
Further, for the simulated transmission spectrum, the response at 0.87 THz was analyzed and it was observed that transmission is higher than the cutoff value of 75% for the (01), (10), and (0,0) configurations, while it is lower than the cutoff for the (1,1) configuration. The truth table corresponding to this observation is shown in Table 3. The response at 0.87 THz corresponds to a Boolean output of NAND configuration. Thus, via simulation, the metasurface demonstrates OR, AND, and NAND operations at 0.97 THz, 0.89 THz, and 0.87 THz respectively.
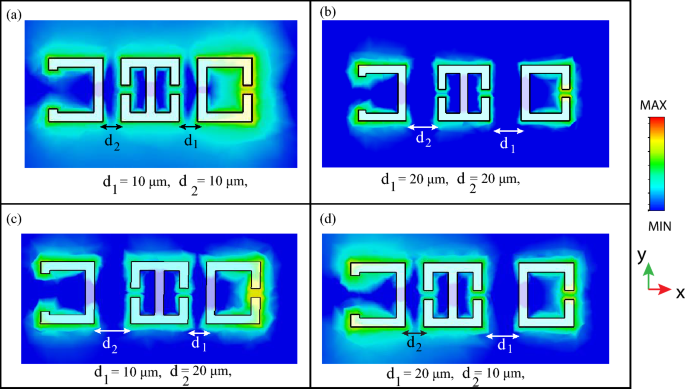
The truth tables for the experimentally analyzed Boolean operations at 0.89 THz, 0.97 THz, and 0.87 THz are illustrated below. The two inputs, input 1 and input 2, depict the distance \(d_1\), and \(d_2\), with the input being “ high” or “1 ” for \(d_1\) or \(d_2\) = 10 \(\upmu\)m, and the input being “ low” or “ 0” for \(d_1\) or \(d_2\) = 20 \(\upmu\)m. The near-field coupling between the resonators was also studied for the different metasurface configurations at the first resonance. Figure 5 demonstrates the near field coupling between the resonators for varying distances \(d_1\) and \(d_2\). Figure 5a shows the \(d_1=d_2=10\,\upmu\)m configuration, and it may be observed that all three resonators are excited and there is strong near-field coupling between the SRRs which verify our consideration of the \(d_1=d_2=10\,\upmu\)m configuration as the 11 Boolean input. We next studied the electric field coupling for the \(d_1=d_2=20\,\upmu\)m configuration. We observe that the three resonators are individually excited by the y-polarized THz radiation, however there is reduced near field coupling between the resonators, as can be seen from Fig. 5b, and we believe this reduced coupling validates our consideration of the \(d_1=d_2=20\,\upmu\)m configuration as the 00 Boolean input. The interaction between the SRRs for \(d_1= 10\,\upmu\)m, \(d_2=20\,\upmu\)m configuration is shown in Fig. 5c. It may be observed that there is stronger near field confinement between the central and right resonators, and weak interaction between the central and left resonators and thus, we consider the \(d_1= 10\,\upmu\)m, \(d_2=20\,\upmu\)m configuration as the 10 Boolean input. The near field interaction in the \(d_1= 20\,\upmu\)m, \(d_2=10\,\upmu\)m configuration is shown in Fig. 5d, and similar to the case of Fig. 5c, stronger near field interaction is observed between the central and left resonator as compared to the central and right resonator. Thus, this verifies our consideration of the \(d_1= 20\,\upmu\)m, \(d_2=10\,\upmu\)m configuration as the Boolean 01 input.

The electric field excited in the four metasurface configurations and analysis of their near field coupling. (a) Electric field profile for the \(d_1=d_2=10\,\upmu\)m metasurface configuration. (b) Electric field profile for the \(d_1=d_2=20\,\upmu\)m metasurface configuration. (c) Electric field profile for the \(d_1=10\,\upmu\)m \(d_2=20\,\upmu\)m metasurface configuration. (d) Electric field profile for the \(d_1=20\,\upmu\)m, \(d_2=10\,\upmu\)m metasurface configuration.

Wanda Parisien is a computing expert who navigates the vast landscape of hardware and software. With a focus on computer technology, software development, and industry trends, Wanda delivers informative content, tutorials, and analyses to keep readers updated on the latest in the world of computing.


